|
|
|
Low Temperature Spectrometer
Below is a block diagram of the low temperature
millimeter/submillimeter-wave spectrometer.
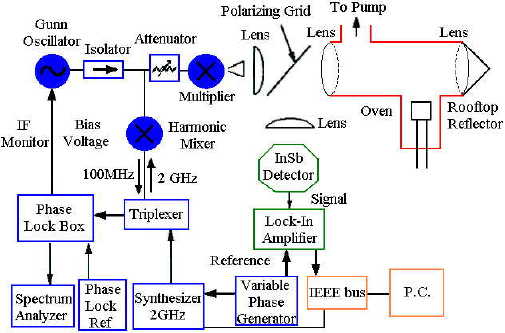
The spectrometer operates in the millimeter/submillimeter-wave
region of the electromagnetic spectrum with near-continous frequency
coverage in the 65-650 GHz range. The radiation source consists of three
Gunn-diode oscillators (65-137 GHz) and Schottky diode multipliers which
can double, triple, quadruple, or even quintuple the Gunn frequency. A
scalar feedhorn is used to launch the millimeter-radiation from the source in
a Gaussian beam shape in one linear polarization. A gold-coated,
tungsten wire polarizing grid allows only this polarization through. The
radiation propagates through the reaction chamber using teflon lenses to
minimize radiation loss. Molecular synthesis occurs in the reaction cell,
which is a water/methanol-cooled, steel vacuum cell (10-40 mTorr)
containing a Broida-type
oven and a d.c.
discharge electrode. At the rear of the cell is a rooftop reflector,
which directs the radiation back through the cell following a 90 degree
polarization change. When the radiation exits the cell, the polarizing
grid now acts as a mirror and directs it into the detector,
an InSb "hot electron" bolometer.
More information can be found in Rev.
Sci. Instrum., 65, 1517, May 1994.
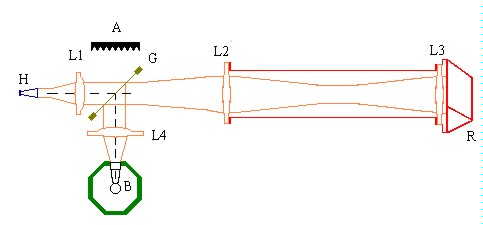
Below is a diagram of the spectrometer optics as designed around the
gas absorption cell. The components are labeled as H: feedhorn;
L1,L2,L3,L4: teflon lenses; G: polarizing grid; R: rooftop reflector; B:
detector lightcone; and A: microwave absorber.
In order to know the exact frequency of the radiation produced, the
Gunn oscillators are phase-locked. This is achieved by choosing
a harmonic of a reference frequency near 2 GHz, which is 100 MHz less than
the Gunn frequency. A phase-lock box is used to compare this 100 MHz
signal to a 100 MHz reference oscillator. The intermediate frequency is
monitored using a spectrum analyzer. Data is generally taken in 100 MHz
intervals by scanning the 2 GHz synthesizer and slowly adjusting the
voltage on the Gunn oscillator in order to keep the system in lock. When
quadrupling the Gunn radiation the result is about 400 MHz of scanning without
manually retuning the Gunn. Finally, phase-sensitive detection is achieved
by frequency modulation of the source at a rated 25 kHz and
using a lock-in amplifier which detects at 50 kHz. This produces a second
derivative spectrum as shown in the spectra section.
Although this is a direct absorption experiment, the spectra appear as if they are
in emission because of a phase shift of 180 degrees.
|